Infogram: A Data Visualization Powerhouse
Overview
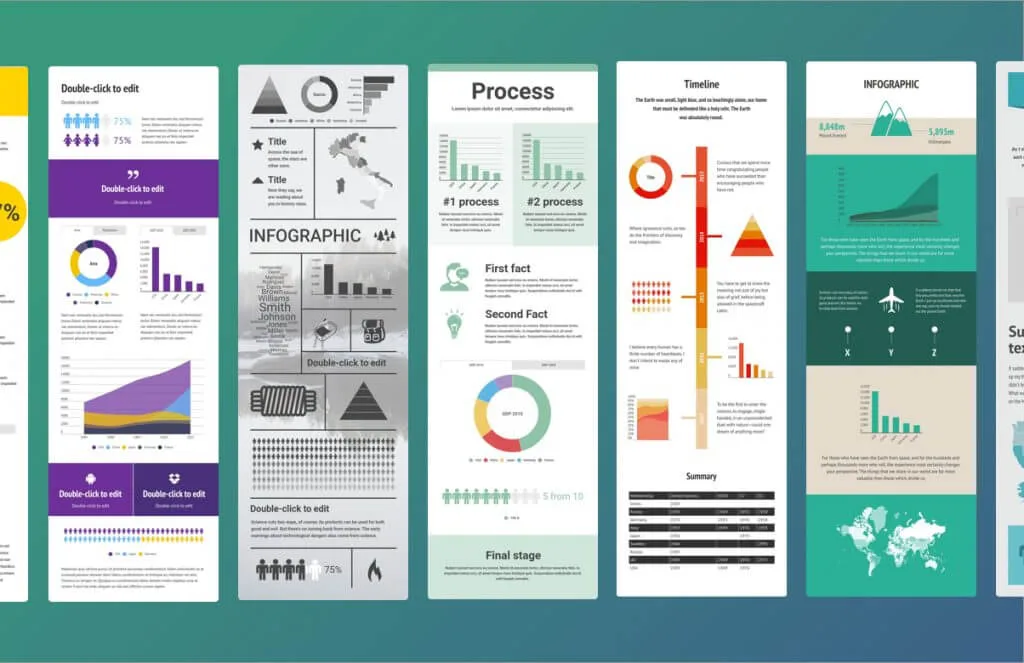
Infogram is a robust infographic creation tool with a primary focus on data visualization. It caters to users looking to convert data sets into visually engaging content and offers infographics in both vertical and social media-friendly sizes.
Ease of Use
The tool’s interface is intuitive, making it easy for users to navigate and create infographics. However, the user’s proficiency with data interpretation may impact how easily they can leverage the platform’s data visualization-centric features.
Features
Infogram’s standout feature is its vast selection of charts, including unique offerings like tree charts and word clouds. Users can manually add data or import it from SQL databases and CSV files. Infogram offers icons from The Noun Project, GIFs and stickers from GIPHY, and a selection of shapes. There are interactive “Callouts” for creating links between slides and external sites, and popular content block style elements, including flowcharts, timelines, and diagrams.
Pricing
Infogram’s free plan provides access to all interactive charts and elements. The Pro plan, priced at $19/month, offers premium templates and allows up to 100 projects. The Business plan, at $67/month, provides a brand kit and supports up to 1,000 projects. The Team plan, priced at $149/month, enables real-time collaboration and provides engagement analytics. Enterprise teams’ pricing is customizable upon request.
Customer Support
Infogram provide email support, FAQs, and a library of tutorials or guides.
Popularity
With its strong emphasis on data visualization, Infogram is a popular choice among marketers, business owners, data analysts, and higher-level education students looking to create data-driven infographics.
Pros
Infogram’s strengths lie in its data visualization capabilities, the interactivity of its “Callouts” feature, and the variety in its infographic templates, including those optimized for social media.
Cons
Infogram doesn’t provide illustrations or animations. Also, its focus on data visualization might make it less appealing to those who wish to create simpler, less data-driven infographics
Overall Rating
4/5. Infogram is an excellent tool for data visualization but might be less appealing to those looking for a broader range of design capabilities.
Go To the Website:
Interested in transforming data sets into visually engaging infographics? Discover the power of Infogram’s data visualization here.
A Friendly Disclaimer from WeblifyAI:
All words colored in orange are clickable links. They’ll take you directly to the source or to our description. Just a heads-up: some of these links are affiliate links. If you decide to make a purchase through them, we might earn a commission. This comes at no extra cost to you and is one of the ways we keep this platform running and filled with resources.
The online world is constantly evolving. Despite our best efforts, there might be times when some information becomes outdated. If you ever come across such instances, please let us know. We’re all in this together, and your assistance ensures that everyone benefits from accurate and up-to-date information.
We aim to help you find the online business that’s the perfect fit for you. Remember, finding your niche takes time, effort, and personal commitment. Never give up, continue learning, and always be ready to put theories into practice. If you have any questions, don’t hesitate to contact us!
Thank you for being a part of our community. Together, let’s make the most of the online world!
Want more? Here are tools you might find interesting:
Podia: The Digital Entrepreneur’s Best Friend
Podia is a versatile ecommerce platform designed for selling digital products. Whether you’re offering online courses, digital downloads, or memberships, Podia has got you covered.
Khoros: The Swiss Army Knife of Social Media Management
Khoros is an all-encompassing tool designed for managing social media accounts and content across multiple channels. It serves as a one-stop-shop for everything from content creation to audience targeting and data storage.
Discourse: Elevate Your Online Conversations and Community Building
Discourse is a robust platform designed for creating and managing online forums. It aims to provide a modern, interactive space where communities can engage in meaningful discussions.


